node_data = FileAttachment("repo_activity.csv").csv()


nodes = node_data.map(d => Object.create(d))

// bfScale = d3.scaleLinear()
//   .domain([1, 5])
//   .range([1930, 2020])
//   .clamp(true)

// scan = crTriggerIndex

chart_param = ({
  width: width - 800,
  height: 600,
  margin: {
    top: 50,
    right: 40,
    bottom: 80,
    left: 60,
    center: 150
  }
})

chart = {
  // Define base scales for positioning circles
  const x = d3.scaleLinear()
    .domain([0, 1])
    .range([chart_param.margin.left, chart_param.width - chart_param.margin.right]);

  const y = d3.scaleLinear()
    .domain([0, 1])
    .range([chart_param.height - chart_param.margin.bottom, chart_param.margin.top]);

  // Initialize SVG container
  const svg = d3.select(DOM.svg(chart_param.width, chart_param.height));

  // Append title and subtitle
  svg.append("text")
    .attr("x", chart_param.width / 2)
    .attr("y", chart_param.margin.top - 25)
    .attr("text-anchor", "middle")
    .attr("font-size", "20px")
    .attr("font-weight", "bold")
    .text("Beeswarm Plot of GitHub Repos Over Time");

  svg.append("text")
    .attr("x", chart_param.width / 2)
    .attr("y", chart_param.margin.top - 10)
    .attr("text-anchor", "middle")
    .attr("font-size", "14px")
    .attr("font-weight", "normal")
    .text("A visualization of repositories in the DOH-EPI-Coders organization");

  // Preprocess data: Map any language that isn't "R" or "Python" to "Other"
  node_data.forEach(d => {
    if (d.language === "Jupyter Notebook") {
      d.language = "Python";
    } else if (d.language !== "R" && d.language !== "Python") {
      d.language = "Other";
    }
  });

  // Group nodes by language using d3.group
  const languages = d3.group(node_data, d => d.language);

  // Viridis colors for languages
  const colorScale = d3.scaleOrdinal()
  .domain(["R", "Python", "Other"])  // List of languages you want to color
  .range(["#5cc870", "#3B528B","#440154" ]); // Adjusted Viridis colors with more green

  // Scale for node radius based on the number of commits
  const radiusScale = d3.scaleLog()
    .domain([1, 5000])  // Adjust the domain to your data range
    .range([5, 17]);      // Adjust the range for the circle radius

// Scale for node radius based on the number of commits
  const radiusLinear = d3.scaleLinear()
    .domain([1, 5000])  // Adjust the domain to your data range
    .range([1, 90]);      // Adjust the range for the circle radius

  // Define x scale based on create_date for grouping by date
  const xScale = d3.scaleTime()
    .domain([new Date("2020-01-01"), new Date("2026-01-01")]) // Set date range
    .range([chart_param.margin.left, chart_param.width - chart_param.margin.right]);

  // Set up the y-scale based on language groups
  const yScale = d3.scaleBand()
    .domain(["Other", "Python", "R"])  // fixed order  // Use the language groups as domain
    .range([chart_param.margin.top, chart_param.height - chart_param.margin.bottom])
    .padding(0.1);  // Add padding for spacing between the groups

  function createNodes(scan) {
    // Sort repos by commits in descending order and get the top 5 for scan == 3
    const topRepos = scan === 3 ? node_data.sort((a, b) => b.commits - a.commits).slice(0, 5) : [];
    const topRepoCommits = new Set(topRepos.map(d => d.commits));

    // Initialize simulation with the base forces
    const sim = d3
      .forceSimulation(node_data)
      .force("x", d3.forceX(d => xScale(new Date(d.create_date))))  // Position along the X-axis based on create_date
      .force("collide", d3.forceCollide().radius(d => radiusScale(d.commits) + 1).strength(0.5));  // Default collision force

    // If `scan > 1`, apply additional forces for language grouping
    if (scan == 1) {
          // For `scan === 1`, apply the default force with no language division
      sim.force("y", d3.forceY(chart_param.height / 2))  // All nodes at the center of Y-axis
        .force("collide", d3.forceCollide().radius(d => radiusScale(d.commits) + 1).strength(0.5));  // Default collision force

      // Create x-axis for years
      const xAxis = d3.axisBottom(xScale).tickFormat(d3.timeFormat("%Y"));
      const xAxisGroup = svg.append("g")
      .attr("transform", `translate(0, ${chart_param.height - chart_param.margin.bottom})`)
      .call(xAxis);

    // Style x-axis labels (make them bold and larger)
    xAxisGroup.selectAll("text")
      .attr("font-size", "16px")    // Set font size to 16px or any value you prefer
      .attr("font-weight", "bold"); // Make the labels bold
    } else if (scan == 2 || scan == 3){
        // Apply additional y-force to divide nodes by language
      sim.force("y", d3.forceY(d => yScale(d.language) + 70))  // Position nodes along y-axis based on language
        .force("collide", d3.forceCollide().radius(d => radiusScale(d.commits) + 1).strength(0.8));  // Adjust collision force

      // Create x-axis for years
      const xAxis = d3.axisBottom(xScale).tickFormat(d3.timeFormat("%Y"));
      const xAxisGroup = svg.append("g")
      .attr("transform", `translate(0, ${chart_param.height - chart_param.margin.bottom})`)
      .call(xAxis);

        // Style x-axis labels (make them bold and larger)
        xAxisGroup.selectAll("text")
        .attr("font-size", "16px")    // Set font size to 16px or any value you prefer
        .attr("font-weight", "bold"); // Make the labels bold

        // Create y-axis for language groups
        const yAxis = d3.axisLeft(yScale);
        const yAxisGroup = svg.append("g")
        .attr("transform", `translate(${chart_param.margin.left}, 0)`)
        .call(yAxis);

        // Style y-axis labels (make them bold and larger)
        yAxisGroup.selectAll("text")
        .attr("font-size", "15px")    // Set font size to 16px or any value you prefer
        .attr("font-weight", "bold"); // Make the labels bold
    } else if (scan==4){
        // Apply additional y-force to divide nodes by language
      sim.force("y", d3.forceY(d => yScale(d.language) + 70))  // Position nodes along y-axis based on language
        .force("collide", d3.forceCollide().radius(d => radiusLinear(d.commits) + 1).strength(0.2));  // Adjust collision force

      // Create x-axis for years
      const xAxis = d3.axisBottom(xScale).tickFormat(d3.timeFormat("%Y"));
      const xAxisGroup = svg.append("g")
      .attr("transform", `translate(0, ${chart_param.height - chart_param.margin.bottom})`)
      .call(xAxis);

        // Style x-axis labels (make them bold and larger)
        xAxisGroup.selectAll("text")
        .attr("font-size", "16px")    // Set font size to 16px or any value you prefer
        .attr("font-weight", "bold"); // Make the labels bold

        // Create y-axis for language groups
        const yAxis = d3.axisLeft(yScale);
        const yAxisGroup = svg.append("g")
        .attr("transform", `translate(${chart_param.margin.left}, 0)`)
        .call(yAxis);

        // Style y-axis labels (make them bold and larger)
        yAxisGroup.selectAll("text")
        .attr("font-size", "15px")    // Set font size to 16px or any value you prefer
        .attr("font-weight", "bold"); // Make the labels bold
    }

    // Restart the simulation to apply the changes
    sim.alpha(1)
      .alphaDecay(0.05)
      .restart();

    // Bind data and draw nodes
    const node = svg.selectAll(".node")
      .data(node_data)
      .enter()
      .append("circle")
      .attr("class", "node")
      .attr("r", d => {
            if (scan === 4) {
            return radiusLinear(d.commits);  // Use the linear scale when scan is 4
            } else {
            return radiusScale(d.commits);  // Use the original scale for other scan values
            }
        }) // Set the radius based on the 'commits' field
      .attr("cx", d => xScale(new Date(d.create_date)))  // Set initial x position based on date
      .attr("cy", d => scan > 1 ? yScale(d.language) : chart_param.height / 2)  // Correct y position based on language
      // style('fill') overrides the circle color. use .attr('fill') for conditional colors!
      // .style("fill", (d) => colorScale(d.language))  // Highlight top 5 repos with orange
      //.style("opacity", (d) => topRepoCommits.has(d.commits) ? 1 : 0.6);  // Lower opacity for non-top 5 repos
      .attr("fill", (d) => topRepoCommits.has(d.commits) ? "#FDE725" : colorScale(d.language))
      .attr("stroke", (d) => topRepoCommits.has(d.commits) ? "black" : "none")
      .attr("stroke-width", (d) => topRepoCommits.has(d.commits) ? 2 : 0);

    // Add tooltips with repo info
    node.append("title")
      .text(d =>
        `Repo: ${d.repo}\n` +
        `Commits: ${d.commits}\n` +
        `Contributors: ${d.contributors}\n` +
        `Create Date: ${d.create_date}`
      );

    // Hover effect to change circle color to red on mouseover, revert on mouseout
    node.on("mouseover", function(event, d) {
      d3.select(this)
        .transition().duration(200)
        .attr("fill", "#FDE725")
        .attr("stroke", "black")
        .attr("stroke-width", 3);
    })
    .on("mouseout", function(event, d) {
      d3.select(this)
        .transition().duration(100)
        .attr("fill", (d) => topRepoCommits.has(d.commits) ? "#FDE725" : colorScale(d.language))
        .attr("stroke", (d) => topRepoCommits.has(d.commits) ? "black" : "none")
        .attr("stroke-width", (d) => topRepoCommits.has(d.commits) ? 2 : 0);
    });

    // Show detailed data on click with line breaks
    node.on("click", function(event, d) {
      const clickTooltip = d3.select("body").append("div")
        .attr("class", "click-tooltip")
        .style("position", "absolute")
        .style("visibility", "hidden")
        .style("background", "rgba(0, 0, 0, 0.7)")
        .style("color", "white")
        .style("border-radius", "4px")
        .style("padding", "10px")
        .style("font-size", "14px")
        .html(`
          <strong>Repo:</strong> ${d.repo}<br>
          <strong>Commits:</strong> ${d.commits}<br>
          <strong>Contributors:</strong> ${d.contributors}<br>
          <strong>Create Date:</strong> ${d.create_date}
        `);

      clickTooltip.style("visibility", "visible")
        .style("top", `${event.pageY + 10}px`)
        .style("left", `${event.pageX + 10}px`);

      // Close the click tooltip after 3 seconds (optional)
      setTimeout(() => {
        d3.select(".click-tooltip").remove();
      }, 3000);
    });

    // Update circle positions on each tick of the simulation
    sim.on("tick", () => {
      node
        .attr("cx", d => d.x)
        .attr("cy", d => d.y);
    });
  }

  // Main logic to check `scan` value and call createNodes accordingly
  createNodes(scan);  // Pass `scan` to createNodes to handle the different plot configurations

  return svg.node();
};Intro to Git and GitHub
what is Git?
- Git is version control software
- projects have branches
- advantages:
- create new branches to test code
- isolate while keeping the
mainbranch clean - version-tracking, keeps track of everything
- prevents overwriting/losing your changes
what is GitHub?
- GitHub is a graphic user interface platform that hosts Git repositories
- repos are used to store project files
- advantages:
- code management: isolate your changes from main codebase
- project management
- collaboration
- transparent, helps see everything

benefits of GitHub - code management
Features:
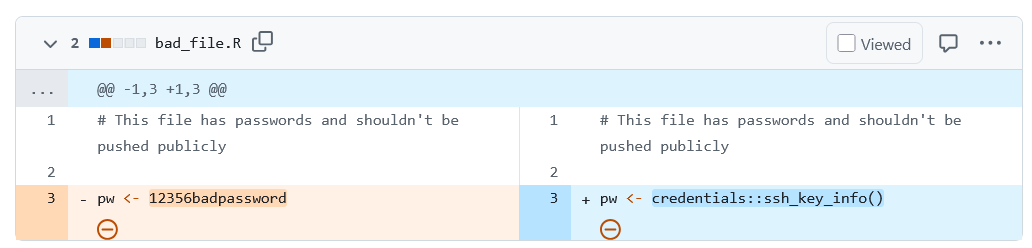
- version history (commits): easily view the entire version history of your codebase
- change attribution: know who did what, and why
- time travel: roll back to previous versions
- structured repositories: organizes scripts and documentation clearly
benefits of GitHub - project management
Features:
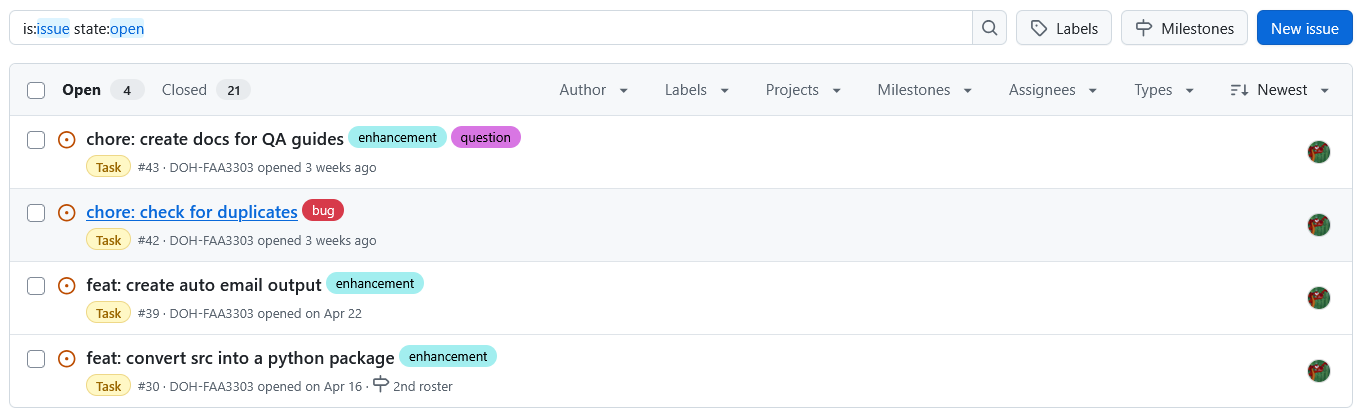
- issues: track tasks, decisions, bugs, and enhancements
- labels and assignees: categorize work and assign ownership
- organization: easy to tag and search tasks
- milestones: group issues to track progress towards goals
benefits of GitHub - collaboration
Features
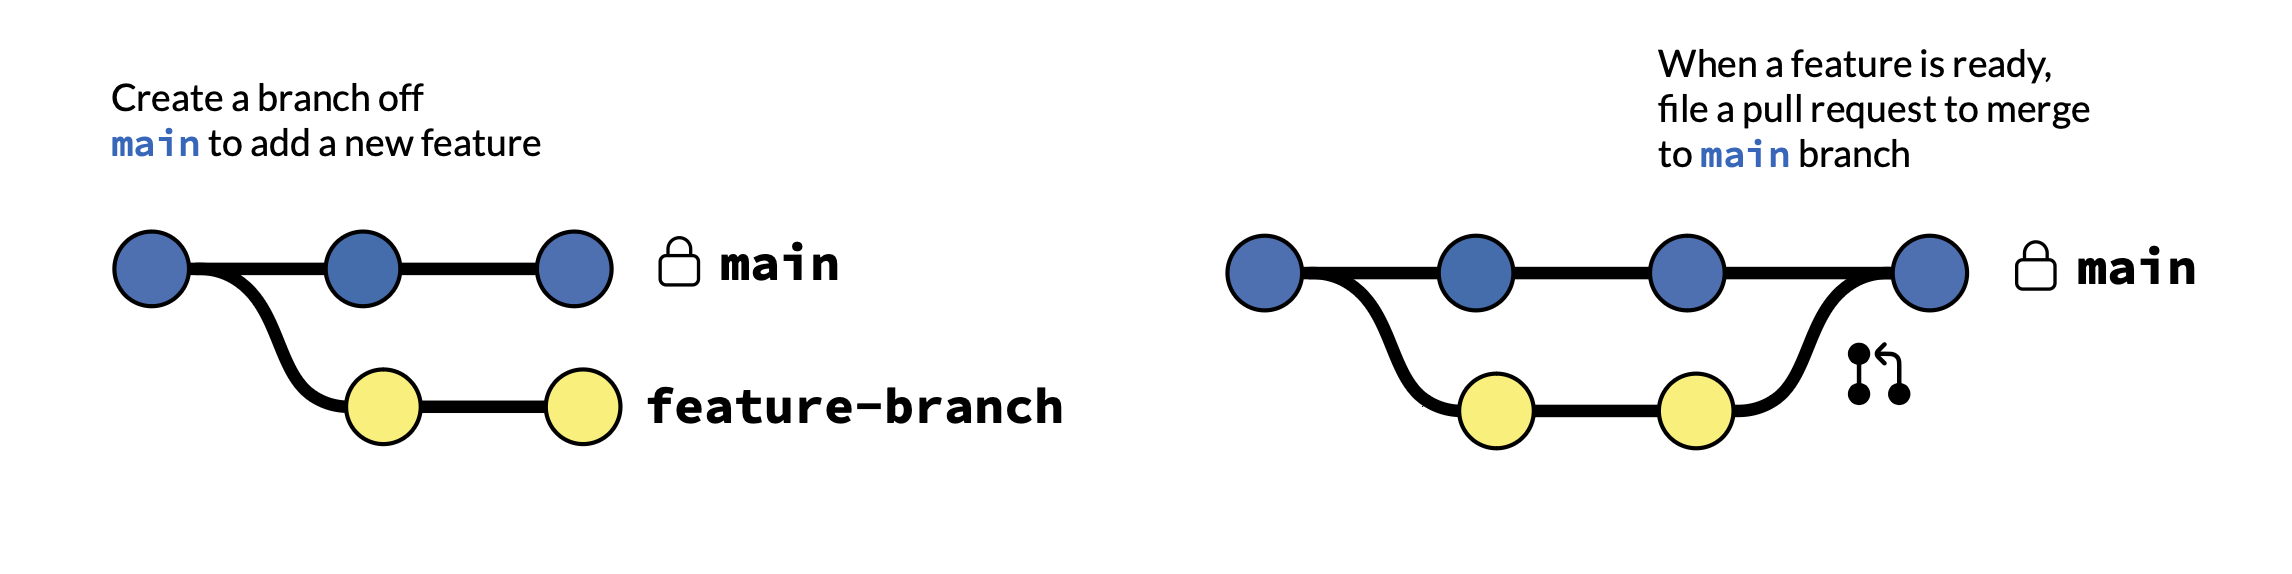
- branches: team members work on different tasks without conflict
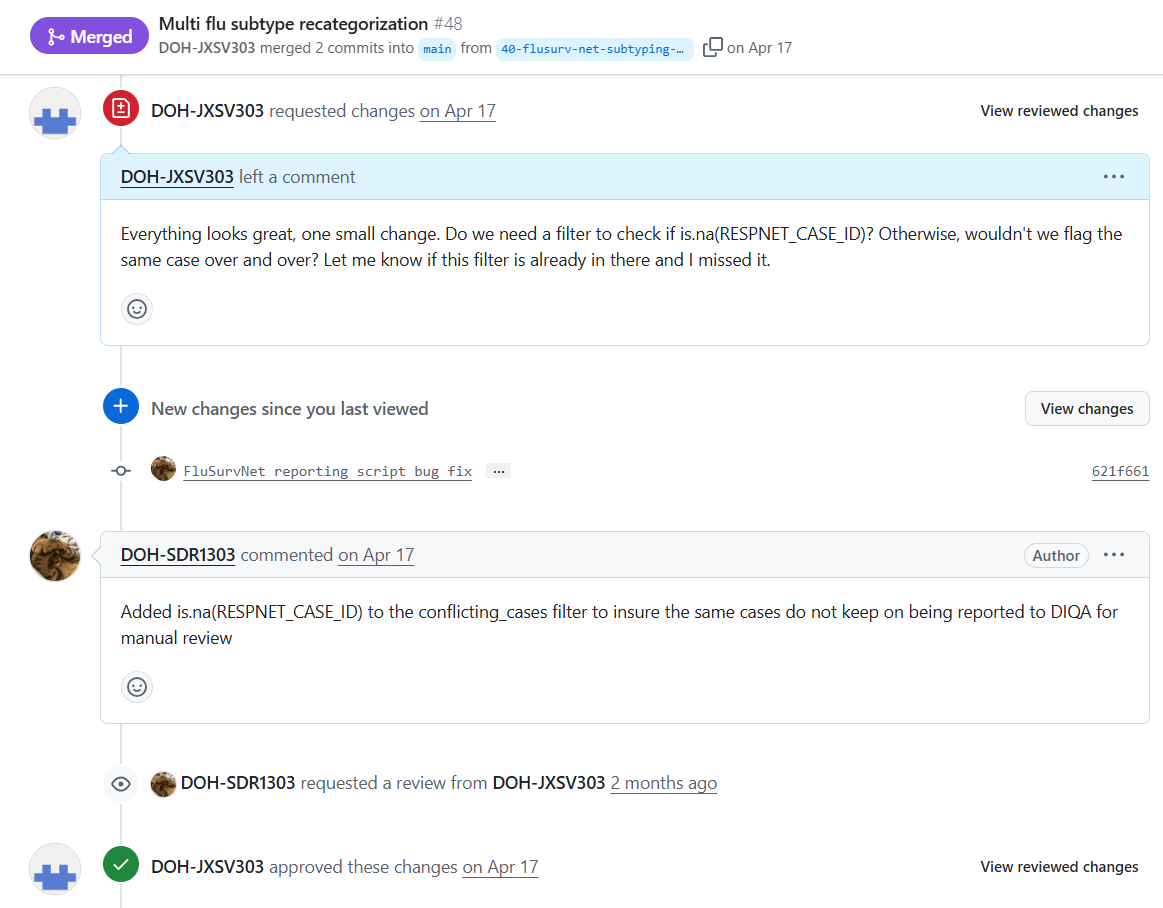
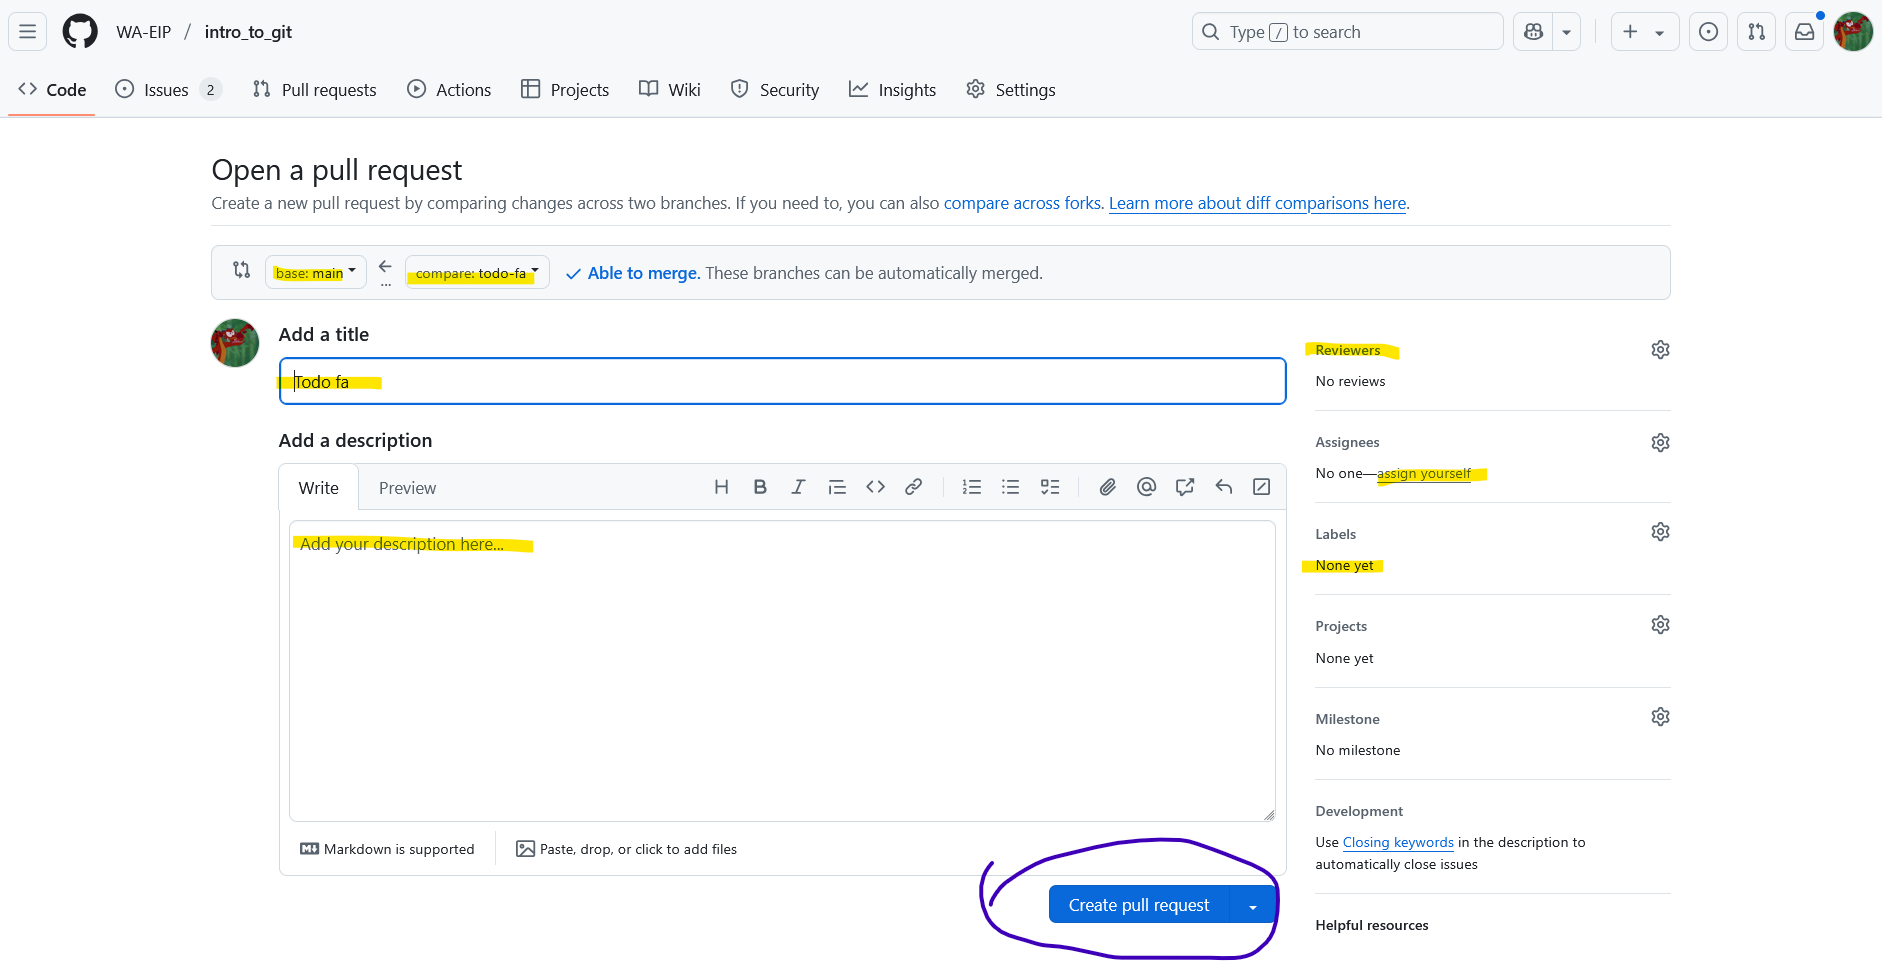
- pull requests: enable code review and discussion
- comment & review: clear contextual communication history
- sharing code: easily share and control access to your code
- organizations, private/public repos
how to use Git/GitHub in practice
- find a repo in GitHub
- clone the repo: copy the whole repo to a folder on your laptop
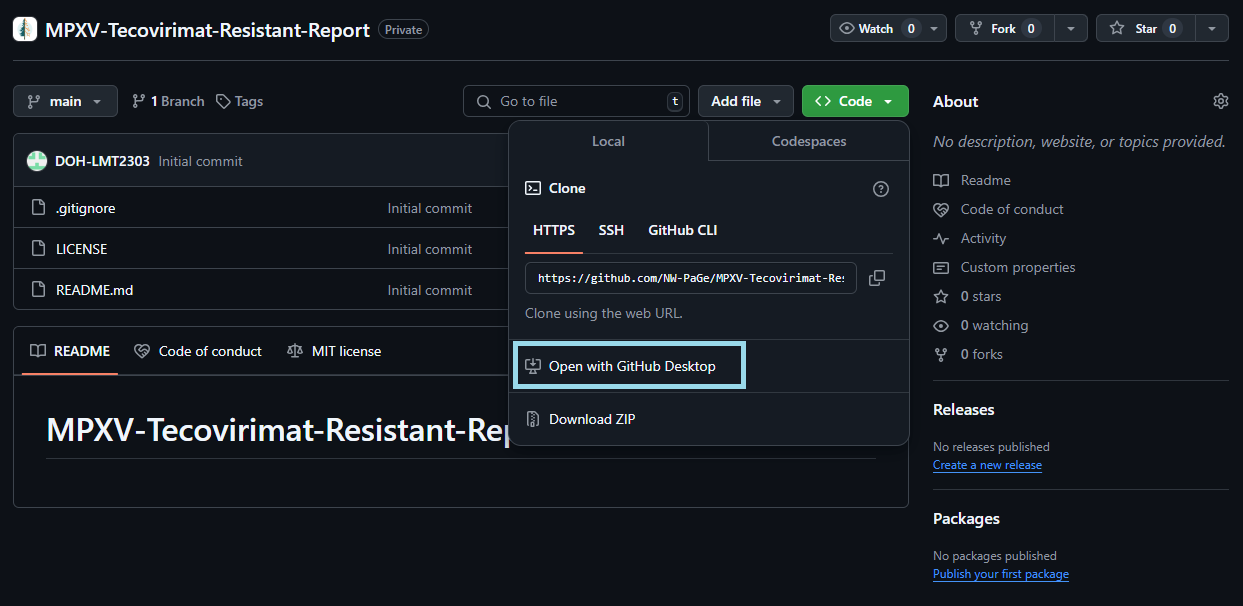
- make your own branch for your isolated edits
- keeps the main branch clean
- write code like normal
- save your code updates, and commit code updates to branch
- commits are changes stored in the branch
- make small, frequent commits if possible
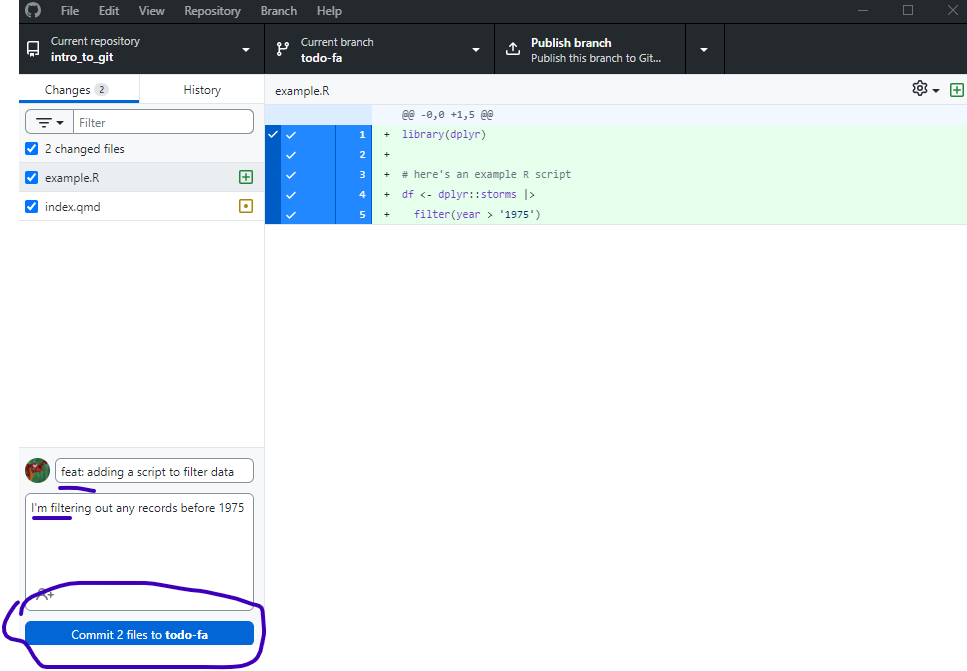
- after you save and commit,
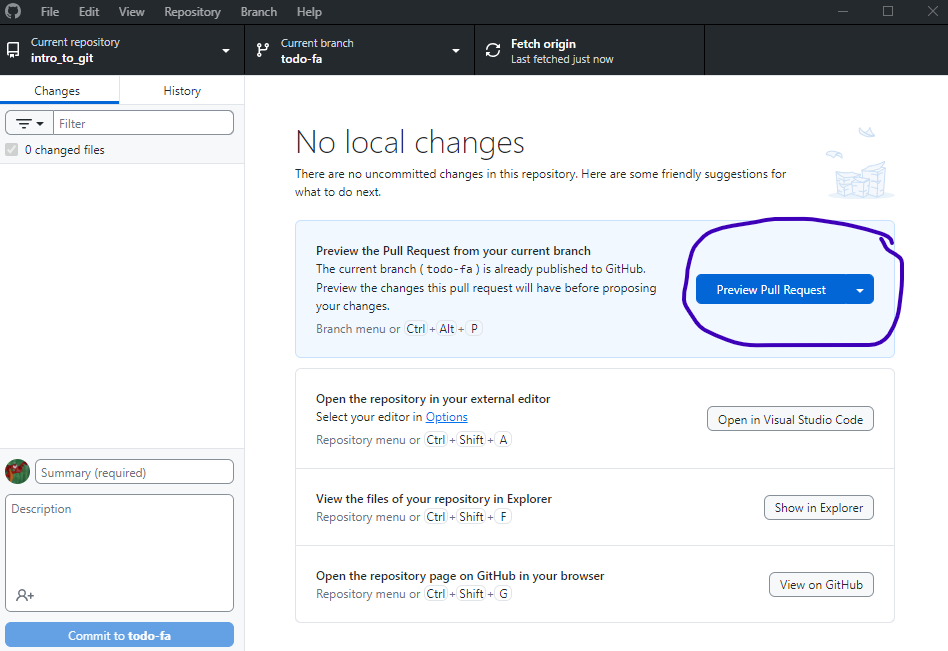
- push branch to GitHub
- if first time creating a branch, must publish first
- like taking your local changes and pushing them to GitHub where your team can see the changes
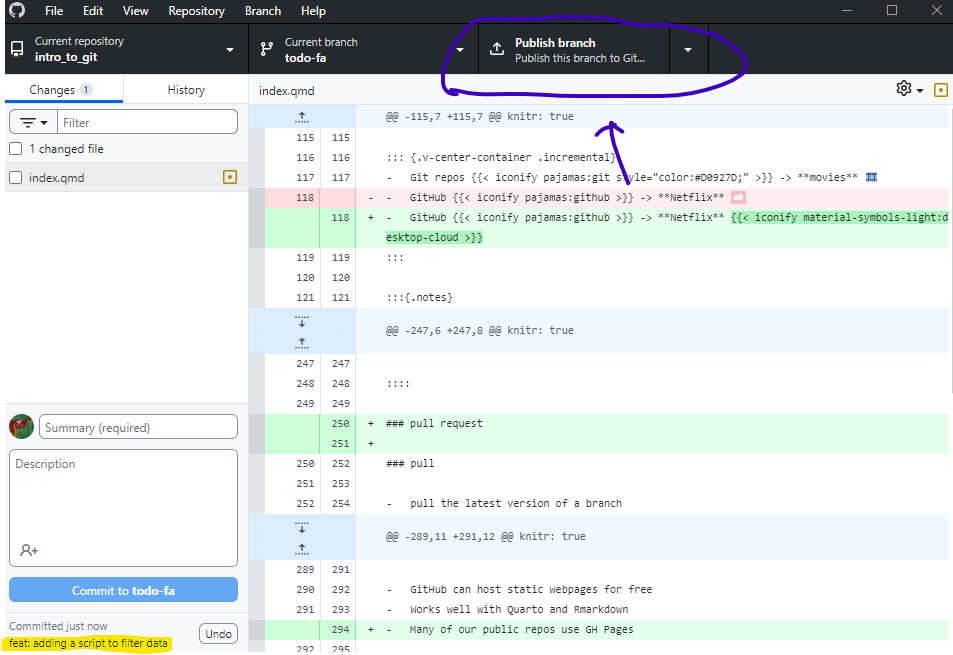
- back in your Git Desktop App, pull the latest version of a branch
- it will pull the latest changes your teammates made into your local clone
- should pull regularly throughout the process